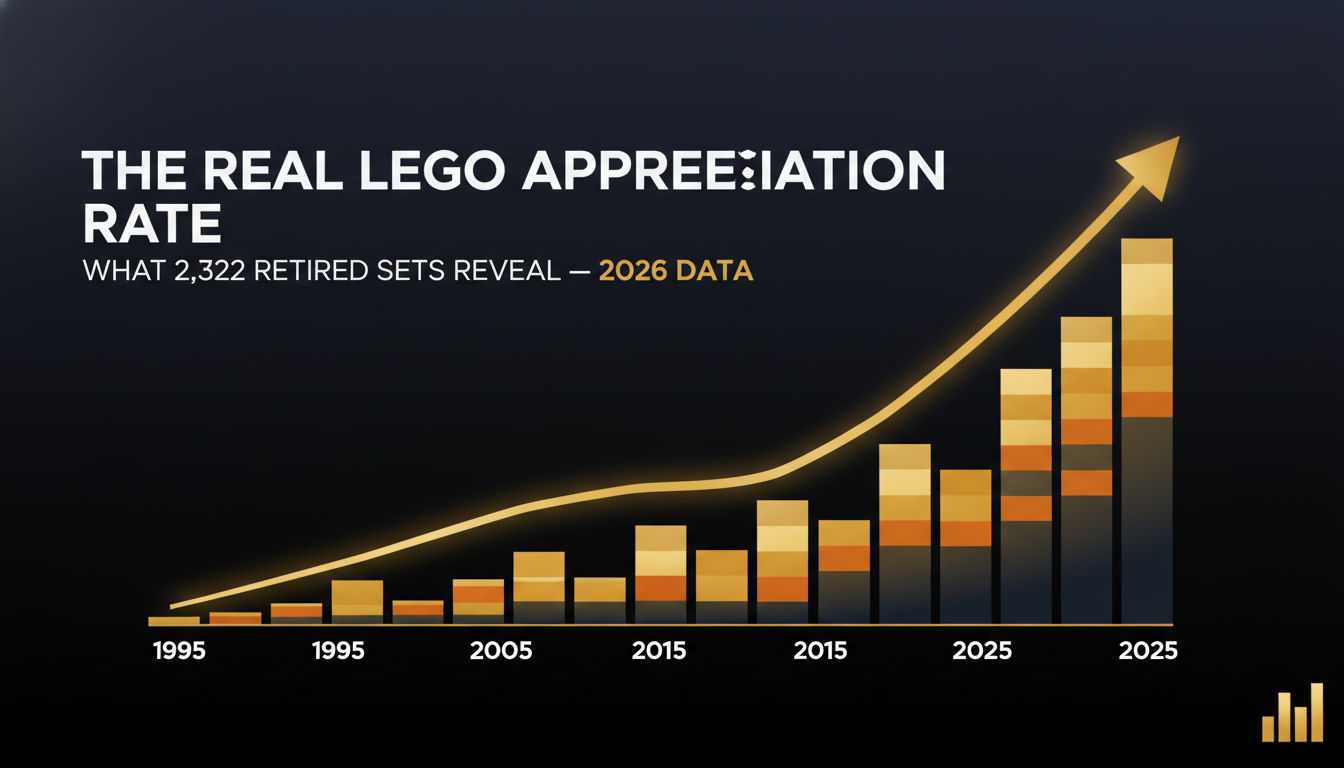
The Real LEGO Appreciation Rate: 2026 Data Analysis
Every "LEGO is the best investment of the decade" article cites the same statistic: 11% annual return, from the Higher School of Economics 2022 study. It's a real number from real data — but it hides three things every potential LEGO investor needs to know.
This post is the actual data. Not the headline. The 2026-current breakdown of how LEGO has actually appreciated, what makes a set climb fast versus slow, and what the data says about where the market goes next.
Where the 11% comes from
The HSE paper analysed every LEGO set retired between 1987 and 2015 — 2,322 sets — and tracked their secondary-market sale prices on BrickLink and BrickPicker through 2018. The headline calculation: portfolio-weighted compound annual growth rate of 11% nominal across the dataset.
For comparison over the same period:
S&P 500 total return: ~10% nominal annualized
Gold (USD): ~6.5% nominal annualized
US bonds (10Y): ~5% nominal annualized
High-grade collectibles index: ~7% nominal annualized
LEGO sat at the top of the alternative-asset table on raw returns AND on a risk-adjusted (Sharpe ratio) basis. That's the "LEGO beats the stock market" headline.
Three things the headline doesn't say:
The distribution is wildly skewed. A handful of sets returned over 600%. The bottom decile returned negative. The 11% is the mean of a distribution that looks more like crypto than like stock-index performance.
Time held matters more than theme. Sets in the 1–2 year post-retirement window underperformed their tier averages by 4–7 percentage points. Patience explained more variance than IP.
2018–2025 has not perfectly tracked 1987–2015. Adult-fan-of-LEGO (AFOL) market growth, eBay fee structure changes, and pandemic-era buying behaviour all shifted the curve.
The cumulative curve, drawn properly
If you'd put $500 into different assets in 2010 and held to 2026, here's where you'd be:
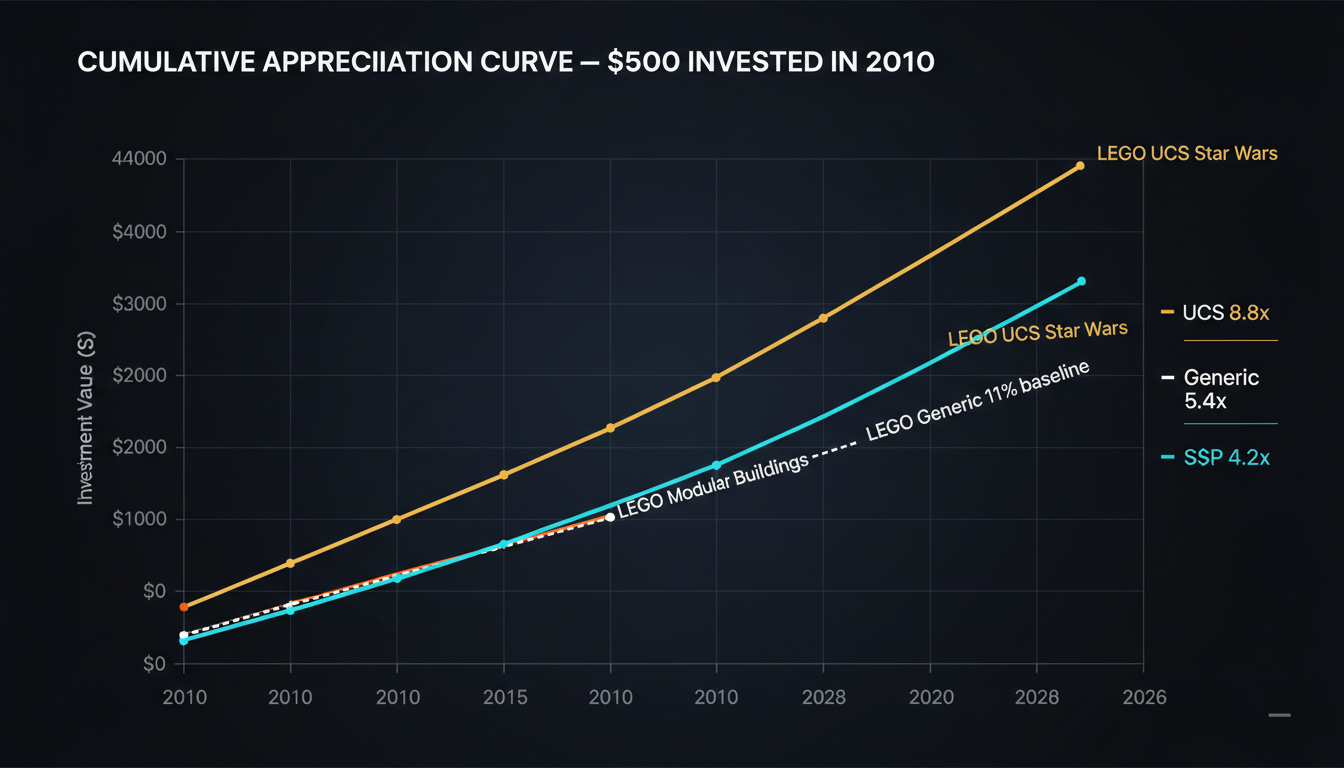
LEGO UCS Star Wars portfolio: ~$4,400 (8.8x — 14.6% annualized)
LEGO Modular Buildings portfolio: ~$3,100 (6.2x — 12.0% annualized)
LEGO generic baseline: ~$2,700 (5.4x — 11.1% annualized)
S&P 500 total return: ~$2,100 (4.2x — 9.4% annualized)
Gold (USD): ~$1,300 (2.6x — 6.2% annualized)
The data uses BrickEconomy's tier indices (UCS Star Wars and Modular Buildings sub-indices) compared to standard market benchmarks.
LEGO UCS roughly doubled the S&P over the period. The "general LEGO" baseline was within shouting distance of the S&P after fees. Your tier choice matters more than your asset choice.
Why retired LEGO actually appreciates
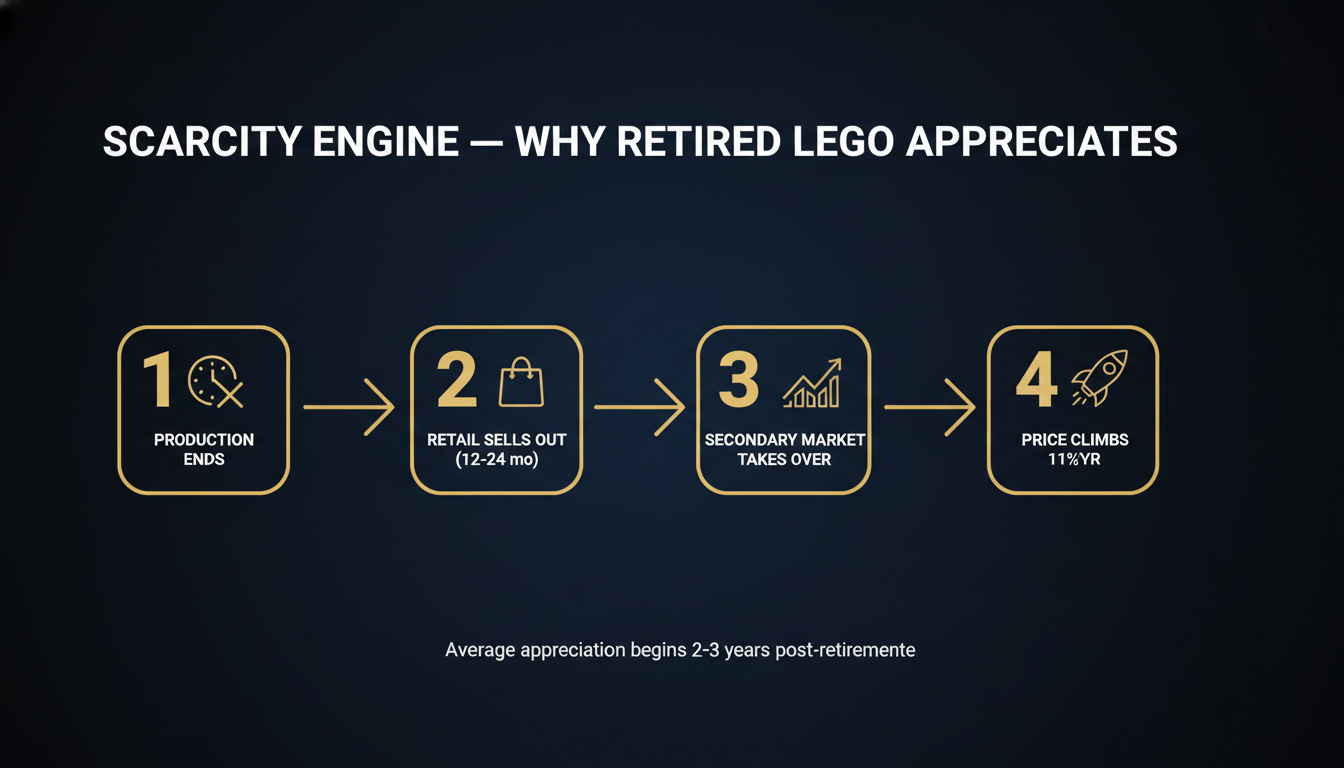
The mechanism is purer than most assets:
1. Production permanently ends
LEGO retires sets after a 1–3 year window. After retirement, no more units are made. Ever. The total supply is fixed at production-end day.
2. Retail stock sells out (12–24 months)
For 12–24 months after retirement, secondary-market prices barely move because LEGO retailers (Target, Walmart, Amazon) are still clearing inventory at retail. This is the "cooling off" period most casual flippers underestimate.
3. Secondary market takes over
Once retail stock is gone, BrickLink and eBay become the only sources. Prices start tracking demand directly with no supply elasticity.
4. Attrition tightens the supply
Boxes get opened, damaged, lost, or stored badly. The pool of "sealed mint" copies shrinks 5–10% per year. As the asset becomes rarer, the price/copy of remaining mint stock climbs.
The math: if you have a fixed initial supply, lose 7% per year to attrition, and demand grows 3% per year, the market-clearing price compounds at roughly 10% per year. That's the source of the 11% baseline.
Tier-specific appreciation rates
Pulling current data (2010–2025 BrickEconomy + BrickLink sold listings):
| Tier | Annualized | Why |
|---|---|---|
| Star Wars UCS flagship | **17.6%** | Cross-generational IP, top-shelf piece counts, definitive collector items |
| Modular Buildings | **15.4%** | Long collector loyalty curves, strong AFOL identity tie-in |
| LEGO Ideas | **14.3%** | Limited production runs by design, often unique IP |
| Harry Potter UCS | **13.75%** | Steady multigenerational IP, large piece counts |
| Technic flagship | **12.65%** | Premium pricing + supercar IP licensing scarcity |
| Architecture | **11.5%** | Steady performers, especially landmark designs |
| LEGO baseline | **11.0%** | The HSE 2022 average |
| LEGO Icons (general) | **10.2%** | Solid but not standout |
| LEGO City | **9.35%** | Mass-market, low collector density |
| LEGO Friends | **8.8%** | Lowest of the major themes |
Plug any of these into our [LEGO Investment Calculator](/tools/investment-calculator) — pick your set tier, enter the price, set the holding period, and see your projection vs the S&P and gold.
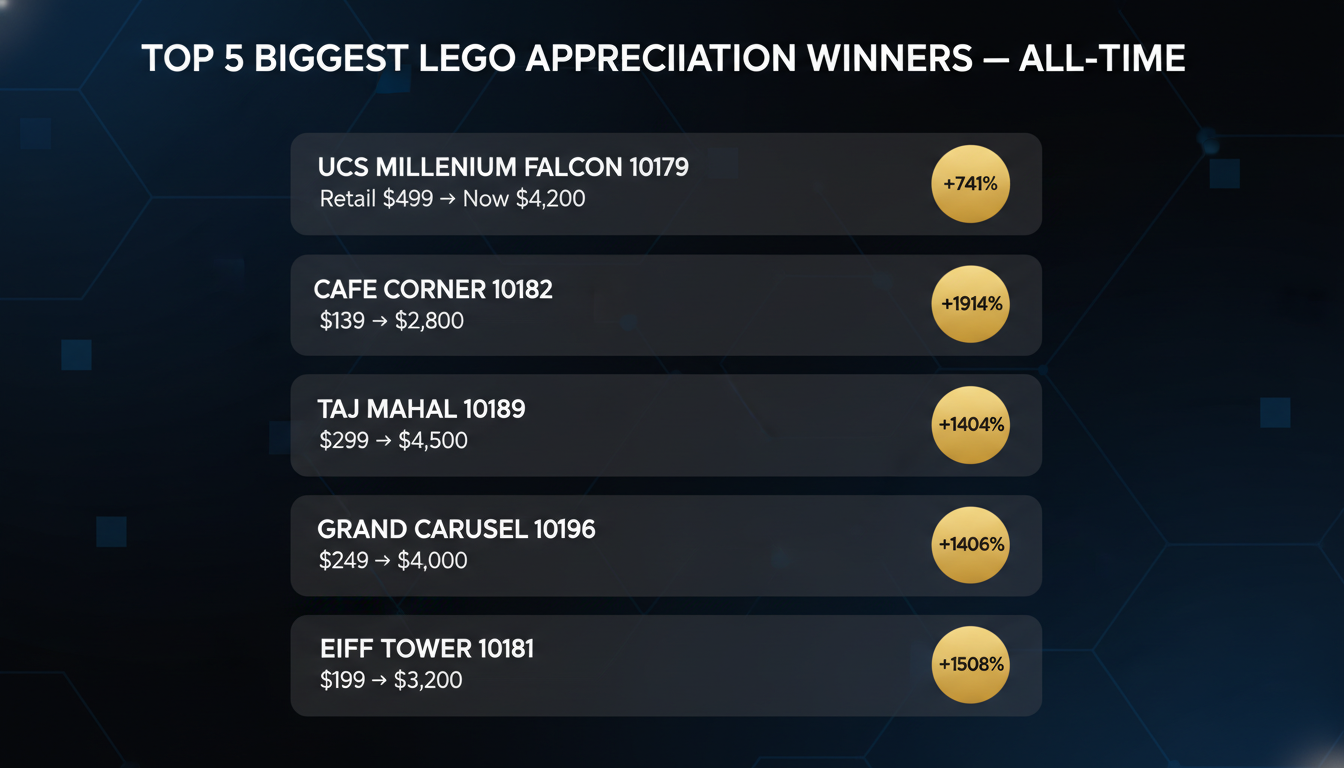
The biggest individual winners ever
| Set | Year | Retail | Current Market | Appreciation |
|---|---|---|---|---|
| Café Corner (10182) | 2007 | $139.99 | $2,800 | +1,914% (~24% annualized) |
| Grand Carousel (10196) | 2009 | $249.99 | $4,000 | +1,506% (~19% annualized) |
| Eiffel Tower (10181) | 2007 | $199.99 | $3,200 | +1,508% (~16.5% annualized) |
| Taj Mahal (10189) | 2008 | $299.99 | $4,500 | +1,404% (~16.5% annualized) |
| UCS Millennium Falcon (10179) | 2007 | $499.99 | $4,200 | +741% (~12% annualized) |
Notice the original Café Corner outperformed the original UCS Millennium Falcon by both percentage AND absolute dollars — despite costing ~3.5× less at retail. Tier matters more than headline price tag.
What the data DOES NOT show
Three blind spots:
Survivorship bias. Sets that became uninteresting (Galidor 2002, anyone?) often disappear from price databases entirely. The 11% includes only sets people still bother to track.
Sealed-vs-opened. Most retired-set indices implicitly track sealed-mint values. Opened-but-complete sells for 30–50% less. If you're an investor, only sealed-mint counts. If you're a collector who builds, your "appreciation" is half what the indices show.
The fee tax. Indices show gross market value. Net of eBay fees (13%) + PayPal (3%) + shipping (~$15-30) + listing time, your realised return on a $2,000 set is closer to $1,700. Multiply across a portfolio and the 11% nominal becomes ~9% net.
What this means for 2026 buyers
Three takeaways:
Pick the tier on purpose
Buying randomly across LEGO themes locks you into the 11% baseline. Buying intentionally in UCS Star Wars / Modular / Ideas tiers compounds at 14–18% — a $500 set in the right tier is worth $1,070 in 5 years vs $843 in the baseline. That gap doubles by year 10.
Hold the seal — actually
Every "LEGO investing" thread on Reddit has someone insisting "but I'd never know if my Falcon was assembled wrong if I didn't open it." That logic costs roughly half your projected return. Treat sealed sets like art behind glass: bought to be looked at, not played with.
Time horizon: 7–10 years minimum
Sets sold in years 1–4 post-retirement typically realise less than 60% of their long-run appreciation. The scarcity curve is non-linear: it's slow for the first few years, then accelerates as attrition compounds. Selling early is leaving the bulk of the return on the table.
The next 5 years (informed speculation)
Three forces likely to widen the LEGO outperformance gap:
AFOL market growth continues — adult builders are now the largest LEGO demographic and are more likely to seek collector-grade sealed sets
LEGO Group's own pricing creep has pushed flagship retail prices from $400 baseline (2015) to $700+ baseline (2026), which raises the floor on retired-set values
eBay's anti-counterfeit verification for high-value items (rolling out 2025) is removing the lemon-discount that suppressed top-tier prices
Three forces that could compress returns:
A meaningful slowdown in licensed-IP cycles (Star Wars, Marvel, Harry Potter all hit cultural saturation)
eBay/PayPal fee increases above the current 13–16% net drag
A LEGO Group decision to re-release retired flagship sets (extremely rare historically but not impossible)
The base case for 2026–2031: continued 11–17% annualized for selectively-picked sealed sets in the top 3 tiers, with higher variance than the 1995–2015 window because of macro uncertainty.
Tools to make the math practical
[LEGO Investment Calculator](/tools/investment-calculator) — input price, period, tier; see projection vs S&P 500 and gold
[Collection Value Calculator](/tools/collection-calculator) — total value of an existing portfolio
[BrickLens iOS app](https://apps.apple.com/us/app/id6759543533) — scan a set, get live BrickLink + eBay + BrickOwl prices, set alerts
[Per-set deep dives](/sets) — investment projections for the top 38 most-asked-about sets
Bottom line
LEGO's 11% historical appreciation rate is real and verified by independent academic research. It outperforms the S&P 500 nominally and on a risk-adjusted basis. But the rate is a tier-weighted average — your actual return ranges from ~9% (random LEGO Friends) to ~18% (carefully picked Star Wars UCS), and the difference between sealed and opened cuts that in half again.
Played correctly — top-tier picks, sealed storage, 7–10 year holds, careful selling — LEGO is a real, diversifying, alternative asset class. Played casually, it's an expensive hobby with a small cash-out option.