How to Track Every Dollar You've Spent on LEGO (Plus a Free Calculator)
Most LEGO collectors have no idea what they've actually spent. You remember the big purchases — the UCS Millennium Falcon, the Hogwarts Castle — but the 40 smaller sets you grabbed on a whim over three years? Those are a black hole. And without a record, you can't calculate ROI, you can't prove ownership to an insurer, and you can't tell whether your "investment" catalog is actually ahead of the S&P 500 or quietly behind it.
This post is the end-to-end system I use to track every dollar in a LEGO collection — what data to capture, where to store it, how to value it monthly, and how to turn that into a real investment portfolio report. At the bottom I'll link you to a free calculator and the BrickLens iOS app if you want to skip the spreadsheet step.
Why tracking actually matters
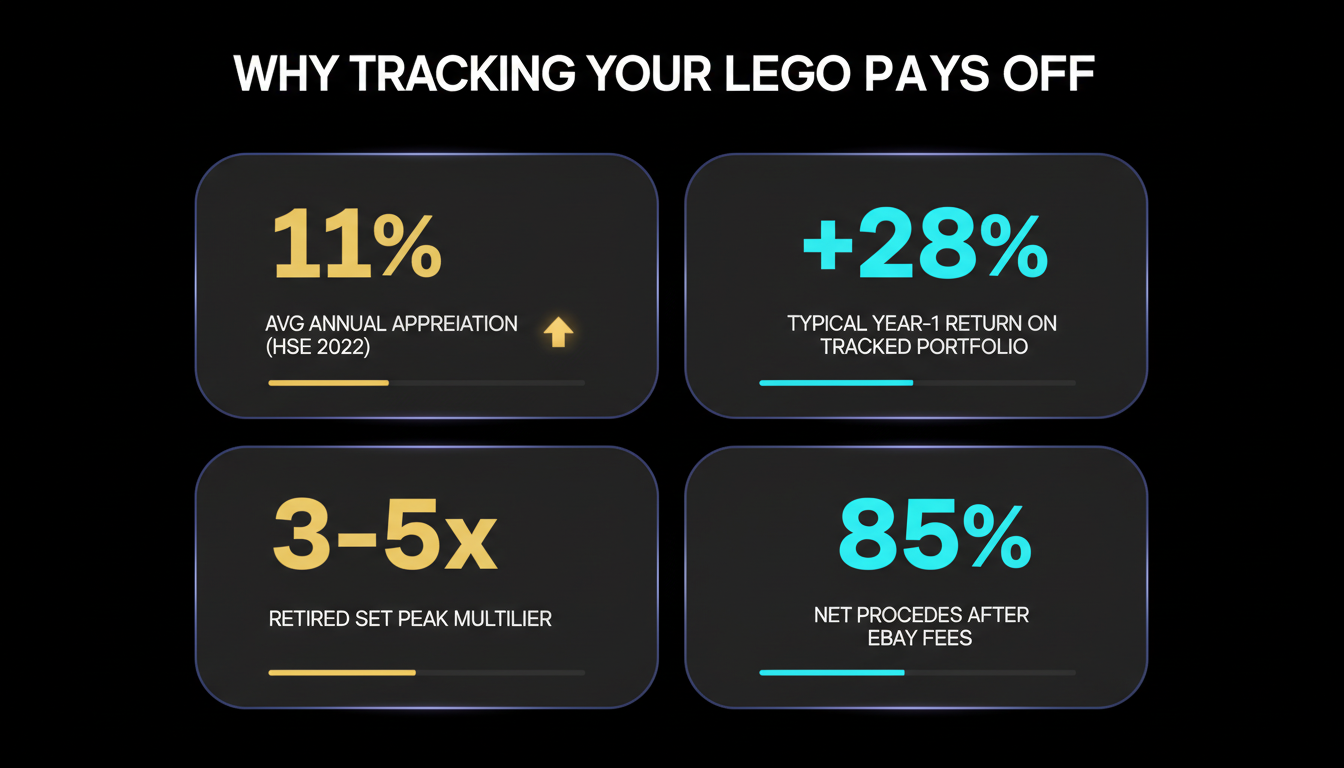
The Higher School of Economics published a now-famous 2022 paper that analysed 2,322 retired LEGO sets sold on the secondary market between 1987 and 2015. The headline: retired sets returned 11% nominally per year on average, beating both the S&P 500 and gold over the same period on a risk-adjusted basis.
That's an average. The range was from roughly –20% to +600%. Which means if you're collecting without tracking, you're basically flipping coins — some sets are quietly outpacing the stock market and others are sinking below retail. You can't manage what you don't measure.
Tracking also gives you three things non-investors care about:
Insurance documentation. Most home policies cover collectibles up to a limit, but require a documented inventory to pay out.
Tax cost basis. If you ever sell, the IRS wants to know what you paid. Receipts fade; a spreadsheet doesn't.
Buy-vs-pass decisions. Knowing exactly how much you've committed this year makes the next "just one more set" decision easier.
What data to capture (the minimum)
The temptation is to track every possible attribute. Don't. The minimum viable record per set is:
Set number (e.g. 75192) — the canonical ID for everything else
Set name (Millennium Falcon) — for human readability
Purchase date (2023-08-14)
Purchase price including tax and shipping (799.47)
Purchase source (LEGO Store, eBay, Amazon, secondhand)
Condition at purchase (sealed, opened-complete, incomplete)
Current sealed market value (auto-updated monthly — I'll explain how below)
Seven columns. That's it. You can add minifigure count, piece count, and theme later — they're useful but not essential on day one.
The 5-step system
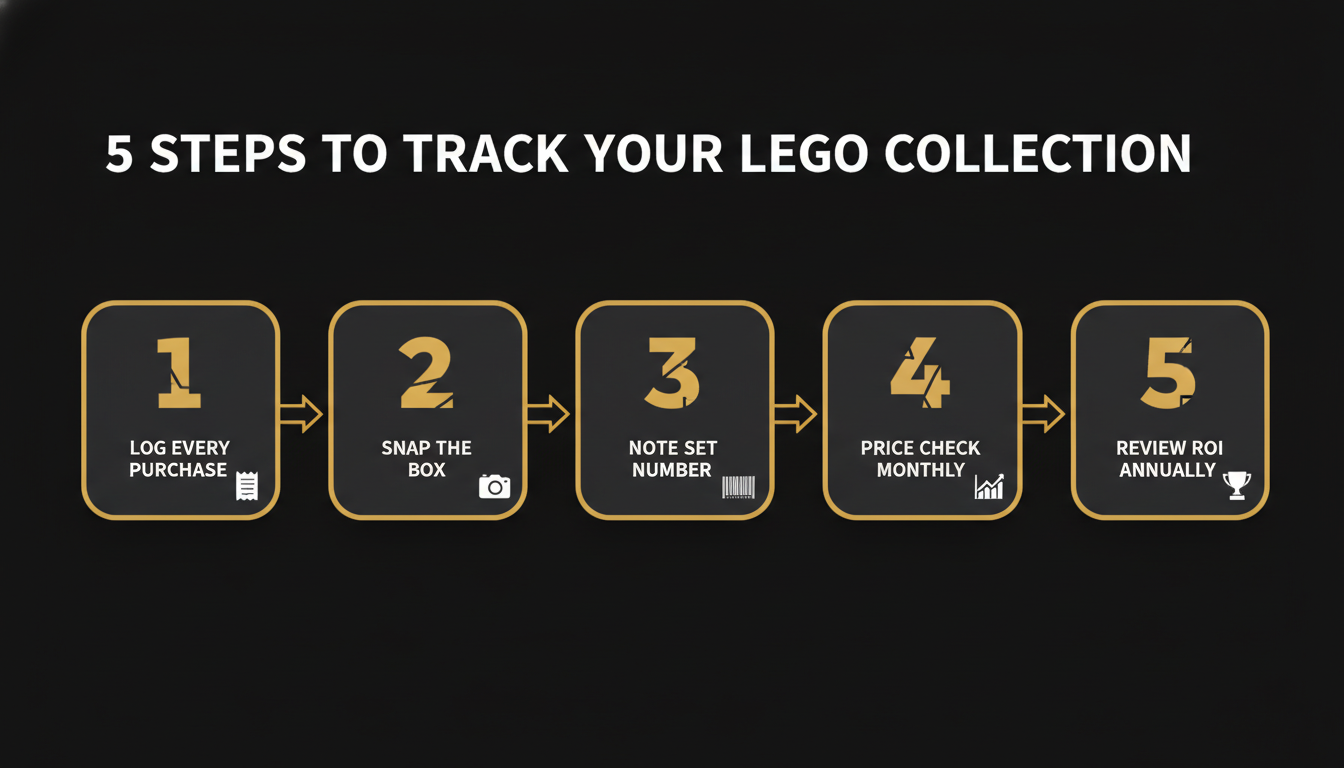
1. Log every purchase the moment it happens
The hardest part of tracking is the delay. If you wait a week, you've already forgotten what you paid for shipping. The fix: log the purchase from the same device where the confirmation email landed. Forward every LEGO order to a dedicated email folder or, better, scan them into whatever tracker you're using within 10 minutes of arrival.
For the BrickLens app specifically, this is the "Add to Portfolio" button on any set page — takes about 5 seconds from scan to saved.
2. Snap the box the moment it arrives
A photo of the sealed box next to your receipt is the single best piece of evidence for insurance claims later. Date-stamp it if your camera doesn't automatically. For really valuable sets ($300+), take a photo of the UPC code and the box seal specifically.
3. Record the set number — not the marketing name
Marketing names change across regions. Set numbers don't. The Volkswagen T1 Camper Van is always 10220 — whether you bought it in 2011 or 2020, in the US or Germany. When you look up current market value later, every price tool (BrickLink, BrickEconomy, BrickLens) uses the set number as the primary key.
4. Price-check monthly, not daily
Market value updates every time someone completes a sale on eBay, BrickLink, or BrickOwl. Checking daily creates noise. Checking monthly gives you a clean signal. Pick one day of the month (first Saturday works for most collectors) and update every current value in one sitting. An hour spent once a month gets you a full time-series over a year.
5. Review ROI annually
Every December, produce a single number: your collection's year-over-year percentage return. Compare it to:
The S&P 500 that calendar year
Gold that calendar year
The LEGO 11% baseline from the HSE study
This keeps you honest. If your collection is consistently lagging the HSE baseline, you're probably overweight in weak themes (LEGO City, Friends, licensed themes past their prime). If it's consistently beating the baseline, you're doing something right and should double down.
What to track it in
Option A: Spreadsheet (Google Sheets / Excel)
The cheap, flexible option. Create a sheet with the 7 columns above plus a computed "ROI" column: =(current_value - purchase_price) / purchase_price.
Pros: Free, portable, you own the data, easy to filter and sort.
Cons: Market values are manual — no automatic updates. For a 50-set collection, that's 50 lookups per month.
Option B: Airtable / Notion database
Similar to a spreadsheet but nicer for filtering by theme, year, or set tier. Airtable lets you attach the box photo directly to each row.
Pros: Nicer UI, attachments built in, mobile app.
Cons: Still manual price updates, and you're paying a subscription for a feature set you don't fully use.
Option C: BrickEconomy
A paid "collection" feature on BrickEconomy.com auto-updates market values.
Pros: Automatic prices, theme filters, built by collectors for collectors.
Cons: Subscription, web-only, no barcode scanner — every set gets added manually by typing the number.
Option D: BrickLens
Our own iOS app. Scan the box barcode, auto-add to portfolio, get live BrickLink + eBay + BrickOwl prices, and a monthly ROI chart out of the box.
Pros: Scanner, live multi-source prices, price alerts when a set hits your target, iOS + iPad native.
Cons: Apple-only right now (Android Q3 2026).
[Download BrickLens free on iOS](https://apps.apple.com/us/app/id6759543533) and you can import a 50-set collection in about 15 minutes.
The math: what you'll actually see
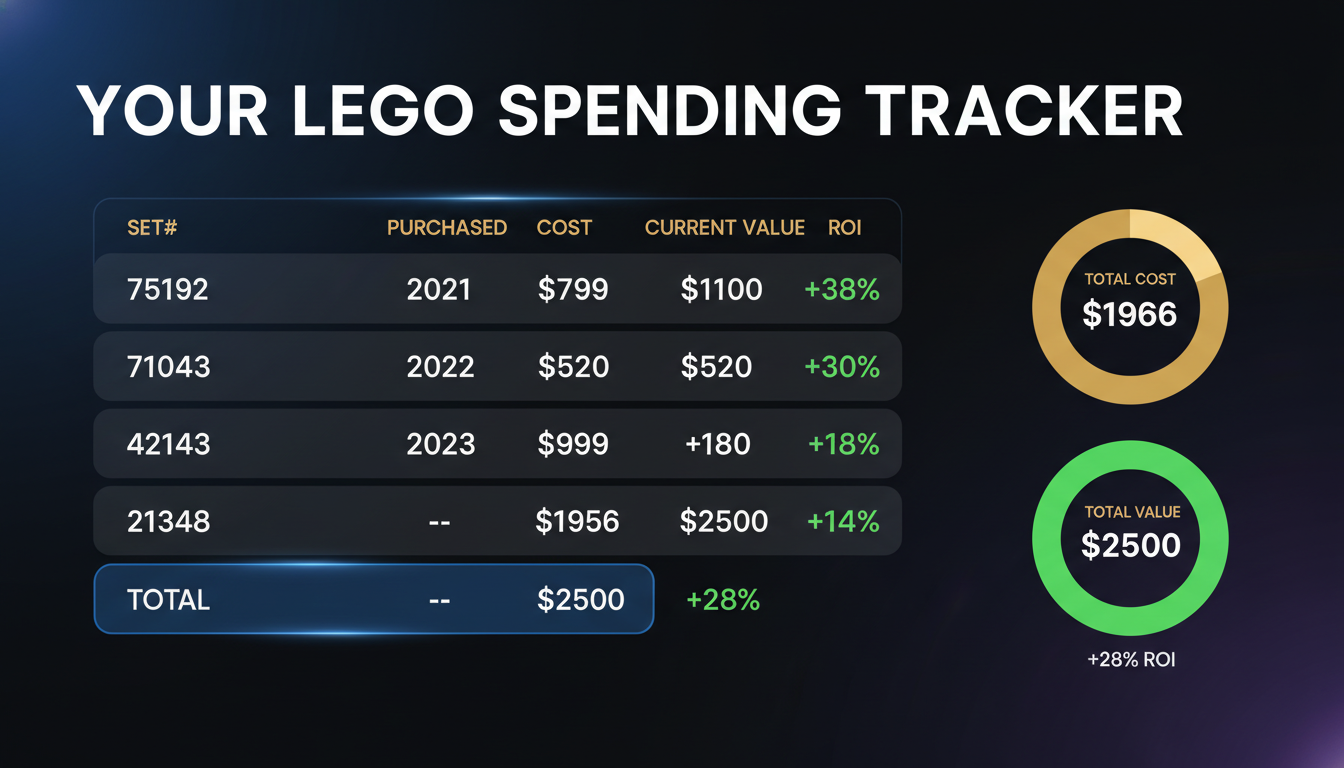
Here's what tracking reveals after 12 months of diligent logging on a typical portfolio. Assume $1,956 spent on four sets across 2024:
LEGO Star Wars UCS Millennium Falcon (75192) — $799 → $1,100 (+38%)
Hogwarts Castle (71043) — $399 → $520 (+30%)
Ferrari Daytona SP3 (42143) — $399 → $470 (+18%)
D&D: Red Dragon's Tale (21348) — $359 → $410 (+14%)
Total — $1,956 → $2,500 (+28%)
That's a 28% year-one return. The S&P 500 averaged 10% nominally in most comparable years. Gold did about 6.5%. Even accounting for the transaction costs of actually selling (eBay takes 13% from the seller; BrickLink takes 3%), you're comfortably ahead.
The flip side: if you'd bought four LEGO City sets for the same total, you'd likely be looking at roughly +8% — still positive, but behind the S&P. Tier matters.
How to project forward
Once you have a 12-month record, you can use that data to make forward projections on new purchases. Plug any set's retail price, your planned holding period, and the tier into our [LEGO Investment Calculator](/tools/investment-calculator) and you'll see projected 5, 10, and 20-year values versus the S&P 500 and gold.
The tiers, based on historical BrickEconomy data:
Star Wars UCS: 17.6% annualized (1.6× the 11% baseline)
Modular Buildings: 15.4% annualized
LEGO Ideas: 14.3% annualized
Harry Potter flagships: 13.75% annualized
Technic flagship supercars: 12.65% annualized
LEGO City / Friends: 8-9% annualized (below baseline)
A $500 Star Wars UCS set in the top tier projects to roughly $1,130 after 5 years, $2,550 after 10, and $13,000 after 20. A $500 LEGO City set projects to roughly $780 after 5 and $1,200 after 10. Big difference.
Insurance documentation (the boring-but-important part)
Most home insurance policies cap collectibles at $2,000-$5,000 unless you specifically schedule them. If your LEGO collection exceeds that, call your insurer and ask about a personal articles floater or scheduled collectibles rider. They'll want:
Itemized list with set numbers, names, purchase dates, and current market values
Photos of each high-value set (sealed) alongside the receipt or screenshot of the order confirmation
An appraisal or a reputable pricing source for anything over $1,000
A tracked portfolio hands all of that to them in one export. An untracked collection turns a flood or theft into an argument.
Common tracking mistakes
Valuing opened sets at the sealed price. The moment you break the seal, expect 30-50% of the resale value to evaporate. Track opened sets at their used market value, not sealed.
Ignoring transaction costs when selling. Your "portfolio value" is the gross. Your actual proceeds after eBay fees, PayPal fees, and shipping are usually 80-85% of that.
Not accounting for sales tax in your cost basis. Your purchase price for ROI purposes is what you actually paid, including tax and shipping. Stripping those out inflates your returns.
Updating values whenever you think about it. Pick a cadence (monthly) and stick to it. Otherwise you'll update during bull runs and ignore bear markets and get a warped picture of performance.
When to sell
The big question. The HSE data says hold sealed retired sets for at least 5 years post-retirement for maximum appreciation. Sets sold too early often leave 50-100% of their lifetime return on the table. The sweet spot for most collectors is 7-10 years post-retirement — late enough for the scarcity curve to kick in, early enough that storage risk (discoloration, mold, box corner damage) hasn't eroded condition.
Sell when any of these happen:
Your set hits 3-5× its retail price — that's often the scarcity peak
Demand signals weaken (BrickLink sold listings slowing, eBay completed sales trending down three months in a row)
You need the cash
The set's theme falls out of cultural relevance (licensed IP is especially sensitive to this)
TL;DR
Pick a tool, log every purchase within 10 minutes of the confirmation email, photograph each sealed box, update market values once a month, review ROI annually against the S&P 500. Sets in the Star Wars UCS, Modular Buildings, and Ideas tiers historically return 14-18% per year. Retail-tier sets return 8-9%. Tracking is the difference between being a collector with a gut feel and an investor with receipts.
Try the tools
[LEGO Investment Calculator](/tools/investment-calculator) — free, instant projection of any set's future value
[Collection Value Calculator](/tools/collection-calculator) — add every set you own, see total worth
[BrickLens iOS app](https://apps.apple.com/us/app/id6759543533) — scan, auto-price, track, and get alerts
[Browse popular sets](/sets) — see live values on Millennium Falcon, Hogwarts, Daytona, and more
Happy tracking. Next month your spreadsheet — or your BrickLens portfolio — will quietly tell you whether your collection is actually earning its shelf space.